
TL;DR
- The strongest evidence is real, old, and narrower than most people claim. The canonical studies are from 2007, 2011, 2014, 2017, 2021 and 2022, and each measured something slightly different.
- Contacting an inbound lead within five minutes rather than thirty raises the odds of reaching a decision-maker by roughly 100 times, per the 2007 Lead Response Management study. That study was not run by MIT, despite being labelled that way constantly.
- Harvard Business Review audited 2,241 US companies in 2011 and found an average first-response time of 42 hours, with 23 percent never responding at all.
- The famous "78 percent buy from the first responder" and "35 to 50 percent of sales go to the first vendor" claims have no traceable primary source. Stop citing them.
- Companies have not got much faster. Chili Piper measured an average first response of 4 hours 50 minutes in 2022, and only 7 percent replying instantly.
- Mid-sized companies are the slowest, not the largest. Firms with 101 to 250 employees averaged 3 hours 42 minutes, worse than both smaller and much larger firms.
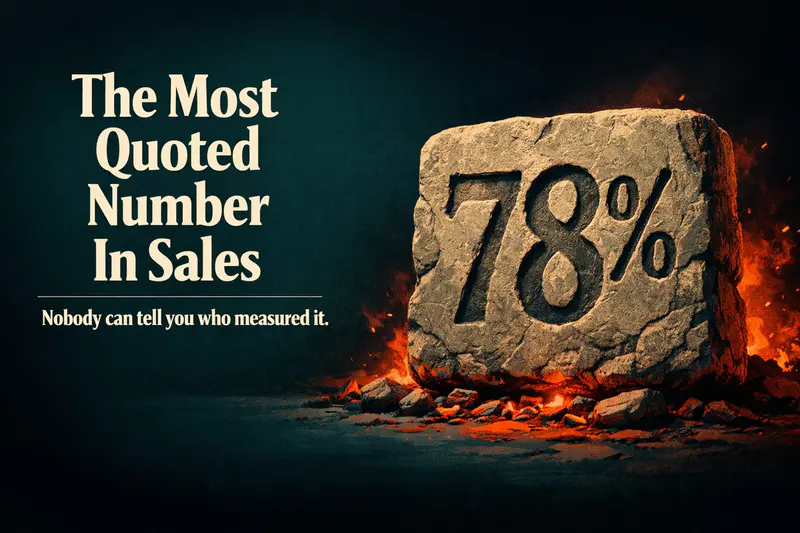
"Seventy-eight percent of customers buy from the company that responds first."
You have seen that sentence. It is on vendor landing pages, in board decks, in the opening slide of every sales-enablement webinar since about 2015. It is the single most quoted of all speed to lead statistics.
Nobody can tell you who measured it.
Speed to lead is the elapsed time between an inbound enquiry arriving and a company making first contact with that person. Speed to lead statistics measure what that delay does to two things: the odds of reaching the prospect at all, and the odds of converting them once reached. The research is real, it is mostly old, and it is narrower than the internet claims.
We went looking for the source of that 78 percent figure. Four different pages attribute it to four different, mutually contradictory origins. One credits a lead-routing vendor. One credits a research firm that has no such paper. One cites a company blog that itself cites nobody.
The number has been passed hand to hand for a decade until the fingerprints wore off.
This matters more than pedantry. Speed to lead is one of the few levers in revenue operations with genuinely strong evidence behind it. Building the case on a forged number is a good way to lose the argument the moment a CFO asks for the source.
So here is the honest version of the speed to lead statistics: every number with who ran it, when, and how big the sample was. Where a famous figure has no traceable origin, we say so and give you the defensible one instead.
What do the speed to lead statistics actually say?
Six studies carry almost all the weight in this field. They are worth separating, because they get blended into a single mush of numbers that no one study actually supports.
The 2007 study everyone calls the MIT study
James Oldroyd's Lead Response Management study, published in 2007, is the origin of the most-cited finding in the category. Contacting a web-generated lead within five minutes rather than thirty minutes improved the odds of reaching a decision-maker by about 100 times. The odds of qualifying that lead improved by about 21 times.
The finding has held up. The attribution has not. InsideSales.com sponsored the work, and hundreds of pages now cite it as an "MIT study." MIT did not run it. Credit Oldroyd and the year 2007, and you will never have to walk it back.
The Harvard Business Review audit
In March 2011, Oldroyd, Kristina McElheran and David Elkington published The Short Life of Online Sales Leads in Harvard Business Review. This one is a field audit rather than a lab finding, which makes it the most quotable thing in the literature. It measured what companies actually do.
They submitted enquiries to 2,241 US companies and timed the replies. The average first response was 42 hours. Twenty-three percent of companies never responded at all.
Firms that made contact within an hour were roughly seven times more likely to qualify the lead than those who waited an hour longer, and more than 60 times more likely than those who waited 24 hours. A common misquote puts that average at 47 hours. The paper says 42.
The minute-by-minute conversion curve
The number people garble most often is the 391 percent figure. It comes from a Leads360 white paper called "Beyond Qualification," and it measures conversion lift by call timing against a baseline, not contact rates.
| Time to first call | Conversion lift |
|---|---|
| Within 1 minute | 391% |
| 60 to 120 seconds | 160% |
| Within 3 minutes | 98% |
| Within 30 minutes | 62% |
| Within 1 hour | 36% |
| Within 24 hours | 17% |
The same paper found 88 percent of leads that eventually converted were called within 24 hours. That is the sleeper statistic in the set. The window is not really five minutes. The window is the first day, and everything after it is salvage.
Speed to lead statistics are not one finding. They are six studies measuring contact odds, qualification odds and conversion lift, and treating them as interchangeable is how the folklore started.
How fast do companies actually respond in 2026?
Badly, and not much better than in 2011. This is the part of the story that has barely moved in fifteen years.
| Study | Year | Sample | Headline finding |
|---|---|---|---|
| HBR / Oldroyd | 2011 | 2,241 companies | 42 hour average, 23% never responded |
| InsideSales.com | 2014 | 9,538 companies | 3h 8m median phone response, 47% never responded |
| Drift | 2017 | 433 B2B SaaS companies | 7% responded within 5 minutes, 55% silent after 5 business days |
| XANT | 2021 | 5.7 million leads | under 1% called within 5 minutes, 57.1% waited over a week |
| Chili Piper | 2022 | B2B sample, disclosed method | 4h 50m average, 7% instant, around 30% never responded |
Be careful reading that last column, because the studies do not all measure the same thing. Three of them report a true "never responded" figure, and those three sit between 23 and 47 percent. Drift's 2017 research reports something different and bounded: 55 percent had not responded within five business days. XANT's 57.1 percent is a waiting-time figure, not a silence figure.
Even on the narrow reading, the conclusion holds. Somewhere between a quarter and a half of all inbound enquiries are simply never answered, and that has been true across three independent studies and two decades.
The second thing in that table is the gap between what teams believe and what they do. XANT's 2021 analysis of 5.7 million leads found conversion roughly eight times higher when contact happened within five minutes rather than six or more. It also found that under one percent of leads got that five-minute call.
Everyone knows the answer. Almost nobody executes it.
Between a quarter and a half of inbound enquiries are never answered at all.
HBR 2011, InsideSales 2014, Chili Piper 2022
Which speed to lead statistics are folklore?
Four numbers circulate constantly and should not.
"78 percent of customers buy from the company that responds first." No traceable primary source. We found this attributed to at least four different and incompatible origins across vendor pages, including one research page that cites nothing at all. Do not use it.
"35 to 50 percent of sales go to the vendor that responds first." Same problem. Widely repeated, never sourced.
"The MIT study." There is no MIT study. It is Oldroyd, 2007, sponsored by InsideSales.com.
"40 to 50 percent of leads arrive outside business hours." Plausible on its face, but we could not find a credible primary source behind the claim. If you need to make the after-hours argument, use Drift's 2017 finding instead. That one is measured, published, and makes the point without inventing precision.
There is a broader tell worth learning. A large layer of AI-generated content farms now recycles these statistics with suspiciously exact sample sizes attached to studies that do not exist. If a page cites a number to three decimal places and links to nothing, it is manufactured.
A statistic with no traceable author is not evidence. It is a rumour with a percentage sign.
Why is the middle of the market the slowest?
This is the most useful and least cited finding in the whole field, and it comes from Chili Piper's 2022 research.
Response speed does not decline smoothly with company size. It collapses in the middle.
| Company size | Average first response |
|---|---|
| 1 to 10 employees | 6 minutes |
| 101 to 250 employees | 3 hours 42 minutes |
| 501 to 1,000 employees | 19 minutes |
The smallest companies are fast because the founder answers the form. The largest are fast because someone bought routing software and staffed a team against it. The middle is slow because it has outgrown the founder and has not yet bought the system.
Call it the Handoff Trough. It is the stage where lead volume has passed what one person can watch and the company still treats first response as somebody's side duty rather than a designed process. If your headcount sits between 100 and 250, the data says you are probably the slowest you will ever be.
Does the channel change the answer?
Yes, and the evidence here is thinner than the timing evidence, so treat it with proportionate confidence.
Drift's 2017 study found that all ten of the fastest-responding companies used live chat, in a sample where only 14 percent of companies offered chat at all. That is a striking correlation. It is not proof that chat causes speed, since companies that install chat are plainly the ones that already care about speed.
Chili Piper's 2022 work found that pairing a form with a chat option moved 31.5 percent of responses into the 5 to 60 minute band and 10.5 percent into instant, with 73.7 percent of buyers rating that experience as excellent. On the demand side, HubSpot Research found in 2018 that 82 percent of consumers rate an immediate response, defined as roughly ten minutes, as important or very important when they have a sales question.
The timing effects are smaller and more fragile than the internet suggests. Two hold up. Oldroyd's 2007 data showed Wednesdays and Thursdays producing around 49.7 percent better connect rates, with late afternoon strongest.
XANT's 2021 data showed Tuesdays converting 19.7 percent better and the 9am to 10am hour 28.4 percent better. Useful at the margin. Not a strategy.
What 254 revenue teams told us about their own response times
Here is data nobody else has, because it comes out of our own pipeline rather than a published paper.
We keep a coded corpus of 511 sales conversations with 254 distinct prospect companies across banking, insurance, healthcare, education, automotive, real estate and direct-to-consumer retail. The coding is heuristic, so treat these as directional rather than precise. The pattern is still hard to miss.
Eighty-six of those 254 companies, about 34 percent, raised follow-up or contactability as a live problem without being prompted. Forty-six named slow response or failed follow-up explicitly as a pain they were trying to solve. Thirty raised speed to lead by name.
What is striking is how specific the asks get. One lending prospect wanted leads reached within 30 seconds of a form fill. An insurance buyer asked for a call inside five seconds of submission. A healthcare group described a 30 minute turnaround as their current best case, achieved by people who had other jobs to do at the same time.
In education the same physics decides enrolment, which is why admissions teams now track time to first contact as a primary metric rather than a hygiene one.
Nobody in that corpus asked for a better lead-scoring model. They asked to be in the conversation before it went cold.
What does the delay actually cost?
Resist the urge to reach for a cost-per-hour figure here. Every tidy dollar number in circulation on this topic traces back to vendor ROI calculators rather than research, and using one undercuts the rest of your case.
The defensible business case is built from the verified multipliers instead. If a quarter to a half of your inbound is never answered, that is your first loss, and it is a pure operational leak with no acquisition cost attached to fixing it. If your median response sits in hours and the evidence says the first hour carries a seven times qualification advantage, the second loss is the qualified pipeline you never created from leads you did eventually call.
Work it from your own funnel. Take last quarter's inbound volume, the share that got a first response inside an hour, and your qualification rate on each cohort. The gap between those two rates, multiplied by the unanswered volume, is your number. It will be more persuasive than anything you borrow, because it is yours.
What actually moves the number
The reason speed to lead has not improved since 2011 is that almost every proposed fix has been a staffing fix. Hire more SDRs, change the shift pattern, add an alert. Those work until volume moves, and then they stop.
The structural fix is to stop treating the first response as a human task. An orchestration layer picks up the enquiry the moment it lands, engages on the channel the buyer used, qualifies against real criteria, and hands a human a conversation that is already warm. The person still closes. They just stop being the bottleneck on the first touch.
That is the work Zigment does as a conversational revenue orchestration platform for revenue teams running on HubSpot and Salesforce. It sits on top of the existing stack rather than replacing it, keeps conversation context intact as the lead moves between channels and systems, and triggers the next action from what the buyer actually said.
In deployments, the effect shows up first in time to conversation. Decorpot cut time to first conversation from 48 hours to 23 seconds and reduced cost per qualified lead by 2.4 times. Tata Motors moved to round-the-clock lead response and halved cost per qualified lead. Bajaj Auto reduced cost per qualified lead by 45 percent while doubling qualified lead volume across more than 20 countries.
The mechanism in each case is the same and it is boring. Something answered immediately, in the buyer's channel, and remembered the conversation afterwards.
You cannot staff your way to a five minute response. You can only design your way there.
The number worth keeping
Forget 78 percent. It was never real.
Keep 42 hours, because it is measured, it is embarrassing, and fifteen years later most companies have not beaten it. Keep the finding that somewhere between a quarter and a half of the people who raised their hand never heard back at all.
Then go and find out which of those two numbers is yours, because the industry average is a comfort and your own funnel is the argument. If it turns out to be the second one, we should talk about your inbound funnel before another quarter of raised hands goes unanswered.