
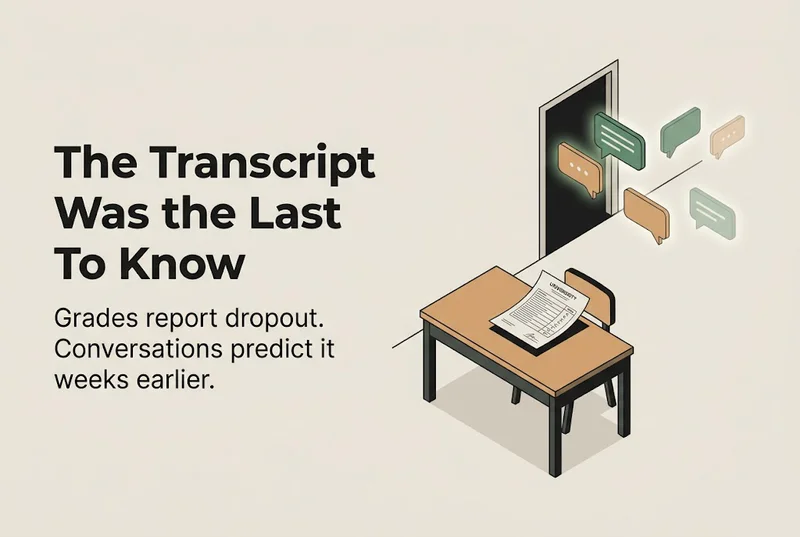
Priya registered for six courses in August. By October she had stopped replying to her advisor's emails. By November her transcript told the story everyone already suspected.
Here is the part nobody talks about: the transcript was the last to know.
Student retention analytics is the practice of using data to identify at-risk students and intervene before they leave. Most institutions track GPA, attendance, and LMS logins. They are watching the rearview mirror. The signals that actually predict dropout live somewhere else entirely: inside the conversations students have across chat, email, advising sessions, and support tickets, weeks before academic performance catches up.
Why Are 22% of Freshmen Still Disappearing?
The comforting lie in higher education goes like this: "We have early alert systems. We track attendance. We flag financial holds. We are on top of retention."
The numbers disagree. 22.3% of first-time freshmen drop out before their second year. Only 64% of full-time bachelor's students finish a degree within six years. The national first-year retention rate hit 83.7%, the highest in a decade according to the National Student Clearinghouse. One in six students vanishes before sophomore year.
That is not "on top of retention." That is The Transcript Lag: the institutional habit of measuring dropout after it has already happened.
The enrollment cliff makes the math worse. The traditional college-age population will shrink by 13% between 2025 and 2041, according to projections from the National Center for Education Statistics. A mid-size university losing 500 students per year at $15,000 average tuition forfeits $7.5 million annually. When fewer students walk through the door, every one who walks out costs more.
The tools exist. Early alert systems. Advising platforms. LMS dashboards. The dropout rate persists. Something in the signal chain is fundamentally broken.
The problem is not a lack of data. It is a lack of listening.
See how behavioral nudging improves retention
What Does Traditional Student Retention Analytics Get Wrong?
Name the signals a standard retention model tracks: GPA drops below a threshold. Attendance falls under a percentage. Assignments go past due. Financial holds appear on accounts.
Every one of those is a lagging indicator. By the time a student's grades reflect disengagement, the decision to leave was made weeks or months earlier. You are reading the autopsy, not the vital signs.
82% of education leaders report difficulty finding accurate information across their institutional systems. The advising platform captures one view. The LMS captures another. The enrollment CRM holds a third. The financial aid office owns a fourth. None of them record what the student actually said when she reached out for help.
Picture The Channel Amnesia Problem in action. A student messages admissions about transfer credit equivalencies in September. She emails financial aid about payment plan options in October. She asks the advising chatbot about reduced course loads in November. Three interactions. Three systems. Zero connection between them.
Nobody noticed the trajectory. Not a person. Not a system. Not an algorithm.
Roughly 80% of the most revealing student signals sit trapped in unstructured conversation data, scattered across channels and departments. Traditional student retention analytics cannot see them. It was never built to look.
Explore how unified data layers eliminate information silos
How Does Conversational Analytics Surface What Dashboards Cannot?
Here is the reframe: stop counting what students do. Start listening to what they say.
Conversational analytics extracts structured intelligence from unstructured interactions. Every chat message, email thread, advising transcript, and support ticket carries signals that no traditional dashboard was designed to display.
Three Signal Types That Power Live Engagement Maps
Intent signals reveal where a student's decision is heading. Is she exploring transfer options at another institution? Asking about withdrawal deadlines? Researching alternatives? Intent tells you the destination before the enrollment status confirms it.
Sentiment signals capture the emotional layer. Frustration with registration processes. Confusion about aid packages. Resignation creeping into tone. These patterns surface in word choice, message length, and response timing long before they appear in an end-of-semester survey.
Urgency signals flag the clock. A student browsing the course catalog in August carries different weight than one searching withdrawal refund policies in November. The questions might look similar in a keyword search. The context surrounding them is completely different.
When these three signal types run continuously across every channel, you get something most institutions have never had: a live engagement health map per student. It updates with every interaction, not every grading period. The gap between student distress and institutional awareness shrinks from weeks to hours.
This is the core shift conversational analytics brings to student retention analytics. Instead of waiting for the data warehouse to confirm what everyone suspected, the system reads signals as they happen and routes them to the people who can act. Advising teams see risk in real time. Financial aid sees distress before the balance goes delinquent. Enrollment sees hesitation before the application is withdrawn.
Stop measuring the wreckage. Start reading the weather.
See why stateless bots fail to capture these signals
What Conversation Patterns Signal Dropout Before Grades Do?
Call it The Language Shift. Students approaching dropout exhibit distinct conversational fingerprints, measurable and consistent across institutions.
They drift from future-oriented language ("next semester plans," "career goals," "elective options") to present-frustration language ("I can't figure this out," "nobody explained," "too late to change"). Message lengths shorten progressively. Response times stretch. Questions stop being exploratory and become transactional.
Then they stop entirely.
AI systems built on these conversation signals can flag dropout risk up to 12 weeks before a student disengages academically. That is an entire quarter of intervention window that GPA-based student retention analytics cannot offer.
California State University deployed a conversational engagement system and measured a 5.6% increase in both enrollment and graduation rates. Institutions using AI-powered conversation analytics report course completion rates 25% to 40% higher than baseline. Risk detection operates three times faster than traditional reporting cycles.
The signals were always there. Every advising chat. Every panicked email. Every terse support ticket. The systems were built to count clicks and grades. Not to listen.
The best predictor of whether a student stays is what she said last week. Not what her GPA said last month.
Discover how lifecycle orchestration supports every student stage
Where Does Student Retention Analytics Fit Across the Full Lifecycle?
The value compounds at every stage of the student journey. The signals shift. The extraction mechanics stay the same.
Where Signals Shift at Each Stage
Enrollment and admissions: Prospective students ask dozens of questions across web chat, email, and social channels before submitting an application. Student retention analytics applied at enrollment identifies which prospects carry high intent versus which ones are casually browsing. Your enrollment team stops distributing equal effort across every inquiry and redirects resources where conversion probability is highest.
Onboarding and first semester: The first 90 days determine whether a student stays. Conversation signals during orientation, course registration, and early advising interactions surface confusion, unmet expectations, and financial stress before the first midterm. Detect early. Intervene targeted. Skip the generic check-in email that gets ignored.
Mid-program engagement: Sentiment shifts in advising conversations, changes in support ticket language, and declining interaction frequency build a composite risk profile over time. You intervene while the student is still reachable. Not after the withdrawal form is filed and the decision is final.
Re-enrollment and graduation: Students approaching registration deadlines who shift from active conversation patterns to silence or terse one-word responses are broadcasting risk. Proactive outreach triggered by conversation signal changes recovers students who would otherwise vanish from the roster without a word. One university system found that signal-driven re-enrollment nudges recovered 8% of at-risk students who had already stopped responding to standard email campaigns.
47% of education leaders already use AI daily. The adoption gap is not about technology. It is about connecting AI to the conversation data where your student retention signals actually live.
Explore how AI orchestration reshapes EdTech outcomes
Why Do 95% of Generic AI Pilots Fail in Higher Education?
MIT research found that 95% of generic AI implementations fail to deliver expected outcomes in education. The reason matters if you are building a student retention analytics strategy.
Let me reframe what "generic" means here. A student asks about financial aid on Monday. She follows up about housing options on Wednesday. The chatbot treats her as two separate strangers. Conversation resets. Context discarded. No pattern builds across touchpoints.
This is The Reset Problem. Every session starts from zero. The intelligence that would reveal risk gets thrown away after every exchange.
Effective student retention analytics requires stateful systems: platforms that maintain a continuous timeline of every interaction, across every channel, for every student. Where the enrollment inquiry connects to the advising conversation, connects to the support ticket, connects to the re-enrollment nudge. One thread per student. No resets. No gaps.
91% of students expect digital services that match the quality of in-person interactions. That standard demands more than a chatbot bolted onto a university website. It demands an intelligence layer that preserves context across semesters, extracts signals from every touchpoint, and triggers the right intervention based on the complete picture.
The institutions getting this right are not buying more tools. They are connecting the ones they already have into a system that remembers.
Read why automation without intelligence runs blind
Building the Intelligence Layer That Connects Every Signal
The missing piece in most retention stacks is not another dashboard. Not another chatbot. It is the connective layer that turns fragmented student conversations into a unified intelligence stream.
How the Conversation Graph Connects the Dots
Zigment's Conversation Graph provides exactly this: a single timeline per student across every channel and system. Chat messages, emails, advising transcripts, and support interactions feed into one living record that captures intent, sentiment, context, and urgency over time. Enrollment teams, academic advisors, and student success staff work from the same picture instead of their own partial view.
When a conversation signal indicates risk, the system triggers the appropriate response: a warm advisor outreach, a financial aid follow-up, a schedule adjustment recommendation. The intervention matches the signal. The student experiences continuity instead of the institutional silence that typically precedes dropout.
Institutions connecting their student retention analytics to conversation data are not predicting dropout after the fact. They are preventing it by acting on signals their current systems were never built to see.
What Actually Determines Whether a Student Stays or Leaves?
Remember Priya? She did not drop out because her GPA dropped. Her GPA dropped because she was already gone. The conversations she had in September, October, and November told that story clearly. Nothing in her university's stack was listening.
Most retention strategies work backward: analyze who left, build a profile from the wreckage. Conversational analytics reverses the direction. It listens to what students are saying right now and surfaces the patterns that predict what happens next.
The enrollment cliff will not pause for you to catch up. Your institution already has the conversation data. Every chat. Every email. Every advising exchange.
The question worth sitting with: is anything in your current stack actually listening?